The main task is to turn the country's resources into a stable supply of marketable products for export and premium segments abroad.
8.8 millionhead of cattle
20.6 millionsheep and goats
4.6 millionhorses
0.3 millioncamels
1.2 million tof meat of all types produced annually
100 thousand tof meat exported annually
3.8 trillion ₸gross livestock output
$8.6 billiongross output — dollar estimate from the presentation
Source cited in the presentation: Kazakhstan Ministry of Agriculture, 2025 results. Figures are rounded; meat figures cover all types. The exchange rate used to convert gross output into dollars is not specified.
Output growth must be supported by feed, veterinary care, processing and sustained demand.
12 millionhead of cattle
28 millionhead of sheep and goats
1.8 million tof meat of all types
165 thousand tof meat exports
+0.6 million tadditional annual output over the 1.2 million t baseline
up to 300 billion ₸allocated for subsidised lending in 2026
Scroll the table left or right.
Subsidised lending programmes listed in the presentation
Programme
Rate
Term / limit
Igilik / Bereke
6%
up to 7 years / up to 5 billion ₸
Zhailau
6%
up to 10 years / up to 350 million ₸
Up to 85% guarantee coverage is envisaged by the plan for selected activities.
Source cited in the presentation: Comprehensive Livestock Development Plan 2026–2030. These are national targets, not achieved results or commitments by the Association.
Central Asia indicators and the US benchmark from the presentation
Indicator
Central Asia
US benchmark
Calves per 100 breeding cows
52
90
Beef breeds in the herd
18%
70%
Pedigree breeding cows
5%
30%
Productivity standards are not yet established as a system. The presentation's premise: premium markets require verified origin and high quality from farm to shelf. Open borders need to be backed by a complete system.
The original slide does not specify the source or period of the comparative figures.
Thousand tonnes. Consumption is calculated market capacity, not the volume actually eaten.
Scroll the table left or right.
Meat balance by type, thousand t
Meat type
Production
Consumption*
Exports
Imports
Beef
435
≈419
>32
16
Poultry
372
≈476.4
31.9
136.3
Lamb
137
≈102.4
34.6
0.0025¹
Pork
52
≈58.3
1.8
8.1
Production · scale 0–500 thousand t
Beef
435
Poultry
372
Lamb
137
Pork
52
Consumption* · scale 0–500 thousand t
Beef
≈419
Poultry
≈476.4
Lamb
≈102.4
Pork
≈58.3
Exports · scale 0–150 thousand t
Beef
>32
Poultry
31.9
Lamb
34.6
Pork
1.8
Imports · scale 0–150 thousand t
Beef
16
Poultry
136.3
Lamb
0.0025¹
Pork
8.1
* Production + imports − exports; excluding stock changes and losses. Beef: rounded estimate, exports >32 thousand t (the source chart uses 32). Calculated lamb consumption in the chart data is 102.4025 thousand t, rounded on the slide to ≈102.4.
¹ Lamb imports — 2.5 t. Sources cited in the presentation: Kazakhstan Ministry of Agriculture responses / Digital Business (24.07.2026), APK Novosti (22.05.2026). The reporting period for the volumes is not separately specified.
The global situation in 2025 as presented in the deck: demand is rising, while supply is not.
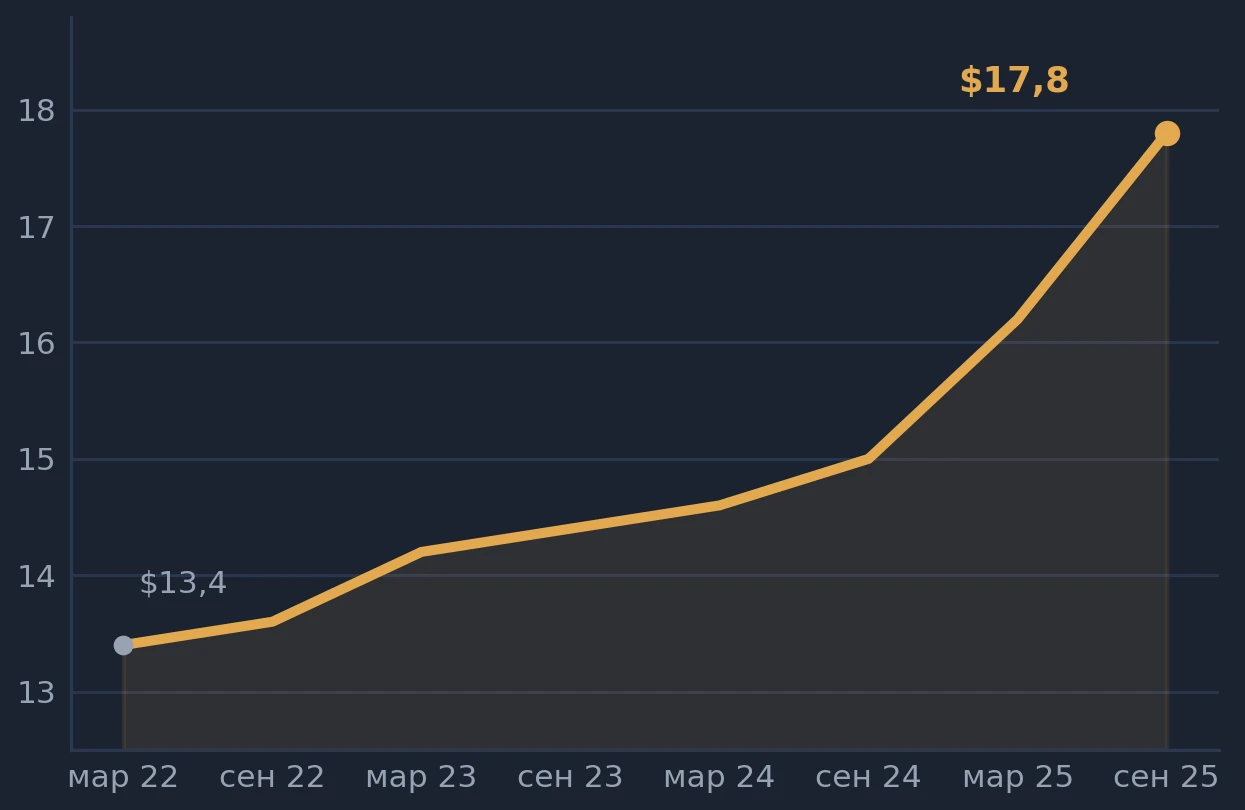
View in detail ↗Global beef price, $/kg: $13.4 in March 2022 → $17.8 in September 2025; +33% growth. Intermediate dates: September 2022, March and September 2023, March and September 2024, March 2025.
+33%price change shown on the chart
−1.9%global cattle herd in 2021–2025: herds are shrinking
−8.1%US herd over 4 years: lowest level since 1951
−3.3%Brazil's herd: environmental limit on pasture expansion
The slide does not specify the price index, methodology, original chart source or the period of Brazil's figure. Intermediate chart points are not numerically labelled.
Delivery times, shelf life and market potential are estimates from the presentation; calculation assumptions and sources are not specified on the slide.
Exports are the Association’s main focus. Exports turn production into capital.
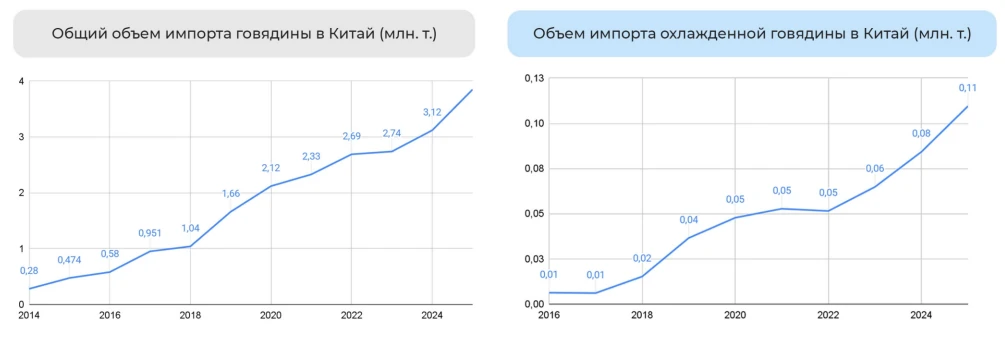
3.8 million tof beef imported by China
×6import volume growth over the last 10 years
around 30%of global beef imports
View in detail ↗Beef imports into China: total volume and chilled beef. Original charts from the presentation.All numerical chart labels by year
Scroll the table left or right.
Values labelled in the image, million t
Year
Total beef imports
Chilled beef
2014
0.28
—
2015
0.474
—
2016
0.58
0.01
2017
0.951
0.01
2018
1.04
0.02
2019
1.66
0.04
2020
2.12
0.05
2021
2.33
0.05
2022
2.69
0.05
2023
2.74
0.06
2024
3.12
0.08
2025
3.8*
0.11
— value not provided. * The final total-import point has no numerical chart label; 3.8 million t is stated in the slide's main text. The year 2025 follows the annual sequence. Chilled beef values retain the chart's rounding.
The statistical source is not specified on the original slide. “Sixfold” and “around 30%” are the presentation's wording, not new calculations.
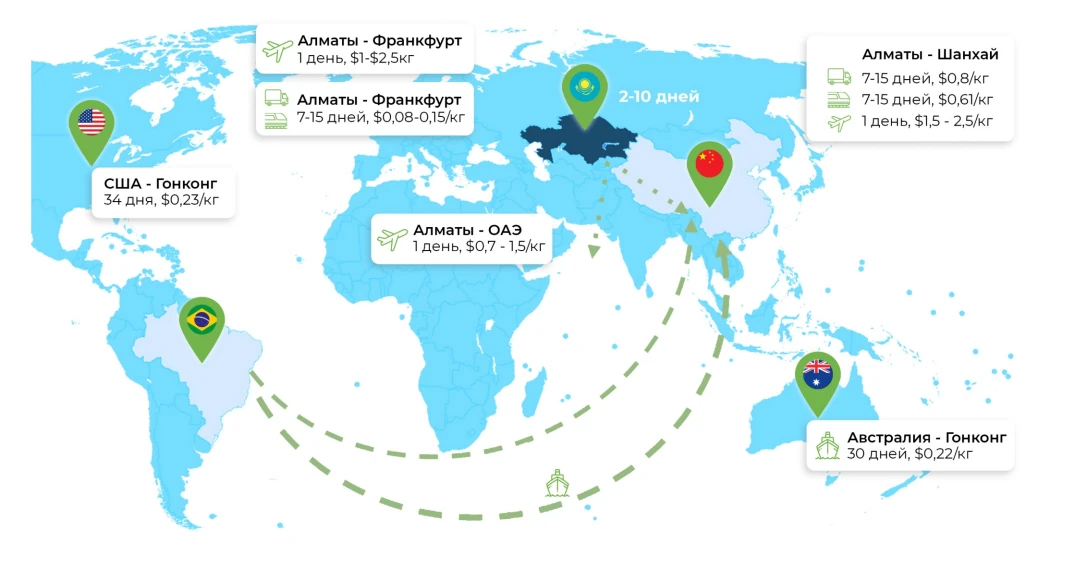
Kazakhstan has an advantage in delivery times to China.
View in detail ↗Logistics and delivery costs from the original presentation. The map also marks Kazakhstan, the USA, Brazil, China and Australia; a separate label near Kazakhstan reads “2–10 days”.Times and costs from the map
Scroll the table left or right.
Terms shown on the map; cost in US dollars per kg
Route
Transport
Time
Cost
Almaty → Frankfurt
Air
1 day
$1–2.5/kg
Almaty → Frankfurt
Road / rail
7–15 days
$0.08–0.15/kg
Almaty → Shanghai
Road
7–15 days
$0.8/kg
Almaty → Shanghai
Rail
7–15 days
$0.61/kg
Almaty → Shanghai
Air
1 day
$1.5–2.5/kg
Almaty → UAE
Air
1 day
$0.7–1.5/kg
USA → Hong Kong
Transport mode not specified in the label
34 days
$0.23/kg
Australia → Hong Kong
Sea
30 days
$0.22/kg
The map gives 1 day for Almaty → Frankfurt by air, while the previous slide groups Frankfurt / Istanbul at 3 days. Both estimates are retained with their source context. The period, tariff components and route for the separate “2–10 days” label are not explained in the presentation.
To establish a position in the premium segment, Kazakhstan needs an end-to-end system from farm to export that meets global quality and traceability standards.
Scroll the table left or right.
Key elements of the premium segment
Key element
Essence
Examples of standards / indicators
High quality and breed
High intramuscular fat content (marbling), consistent meat structure and texture.
The premium segment is defined by meat characteristics, full traceability of origin, environmental responsibility and compliance with recognised international standards.
The presentation states Kazakhstan's intention to use standards such as USDA Beef Grades and Standards as a basis for its own quality grading system.
The list and initiative status are taken from the presentation. One source column combines grading systems, certifications, breeds and production characteristics.
The sequence follows slide 15 of the original presentation.
01 / Capacity
Production base
Establish 20 000 farms for breeding, with 150 breeding cows each.
Launch 1 000 farms for backgrounding, with up to 2 000 head.
Build 1+ million feeding places at feedlots.
Build export-oriented meat processing complexes for 2.3 million head.
02 / Genetics
Cattle numbers and quality
Increase breeding cow numbers to 6 million head.
Raise the share of beef-breed cattle to at least 50%.
Achieve a calf output of 80 calves per 100 breeding cows.
03 / Land
Feed resources and pastures
Expand forage crop areas to 4 million ha.
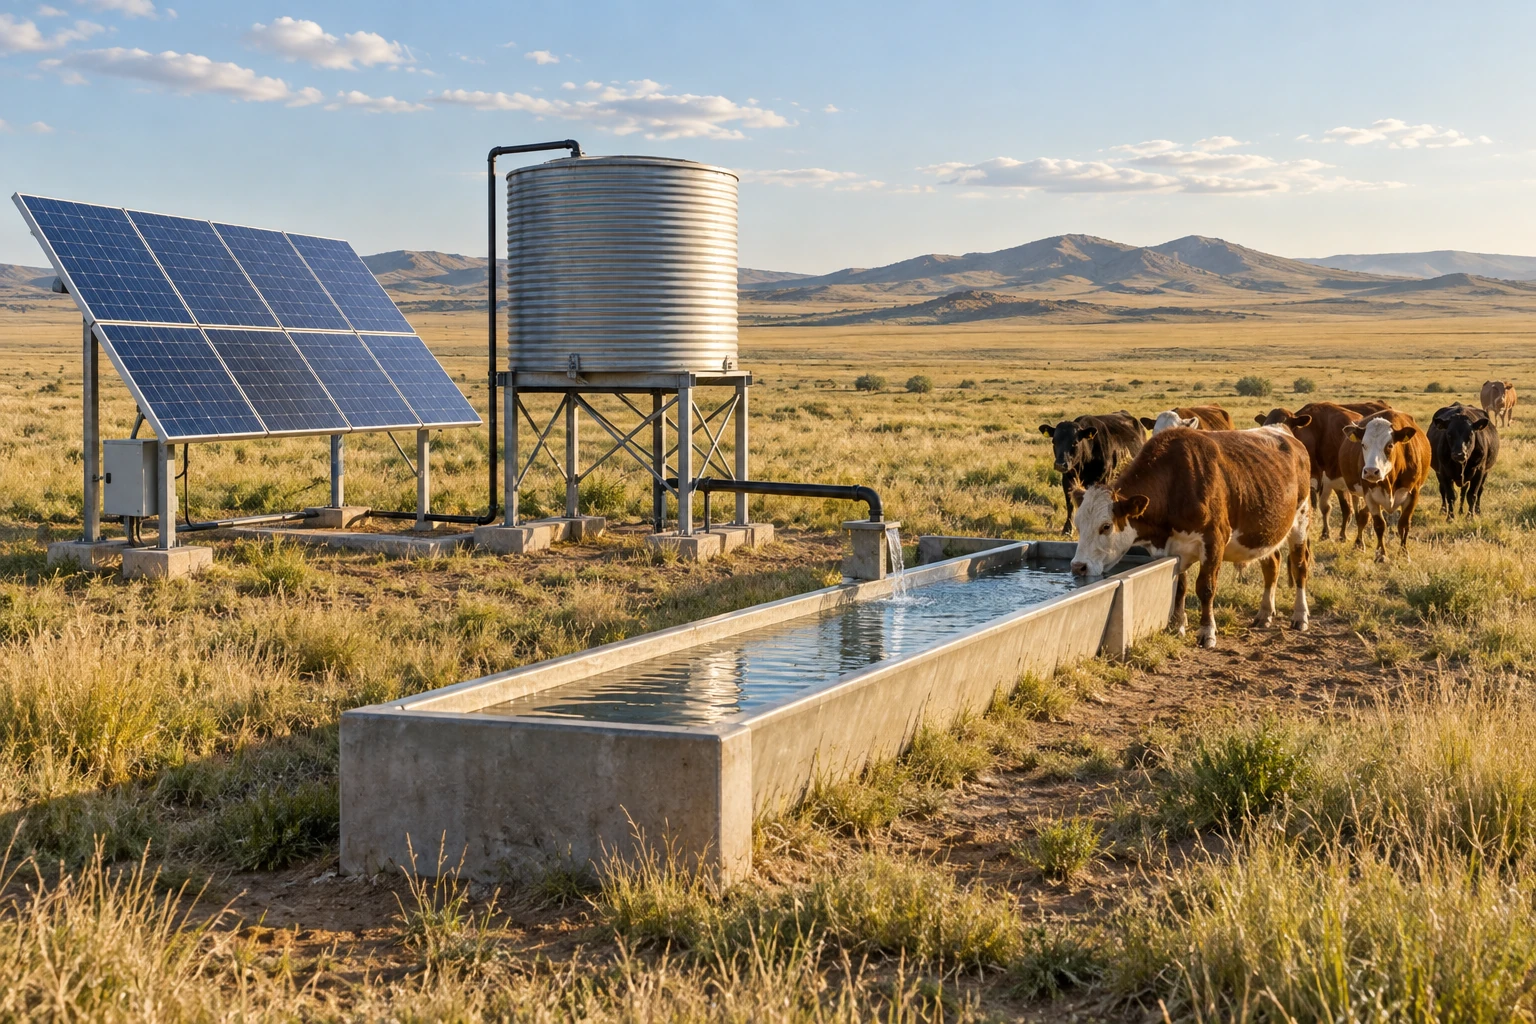
Allocate reserve land and improve 40 million ha of pasture with water infrastructure and wells.
Introduce modern methods of effective pasture management.
04 / Infrastructure
Water and infrastructure resources
Develop cold-chain storage and logistics infrastructure.
Introduce water-saving technologies across 370 thousand ha.
Establish 4 million t of feed storage capacity.
Expand the specialised machinery fleet to 1 000 units and refrigerated storage to 50 thousand t.
05 / Capital
Finance and insurance
Meet up to 75% of the agricultural sector's needs for borrowed funds.
Extend loan terms to 20 years with tailored repayment schedules.
Review collateral policy.
Introduce income insurance subsidies from 2026.
06 / Skills
People and veterinary care
Maintain FMD-free status — a key export requirement.
Train 100 thousand farmers.
Delegate up to 50% of state veterinary service functions to private professionals.
Include 100% of exporting enterprises in importing countries' registers.
Proposals and targets from the TURAN presentation, 2026. The slide does not define a common delivery deadline, budget or responsible parties for each area.